PACIFICA Data and Products
PACIFICA current version : 12.05
The number of "12.05" means that all adjustment values were approved in May 2012.
NOTE that the products below may be updated by change of source data and other reasons.
Please see Change Log in more detail.
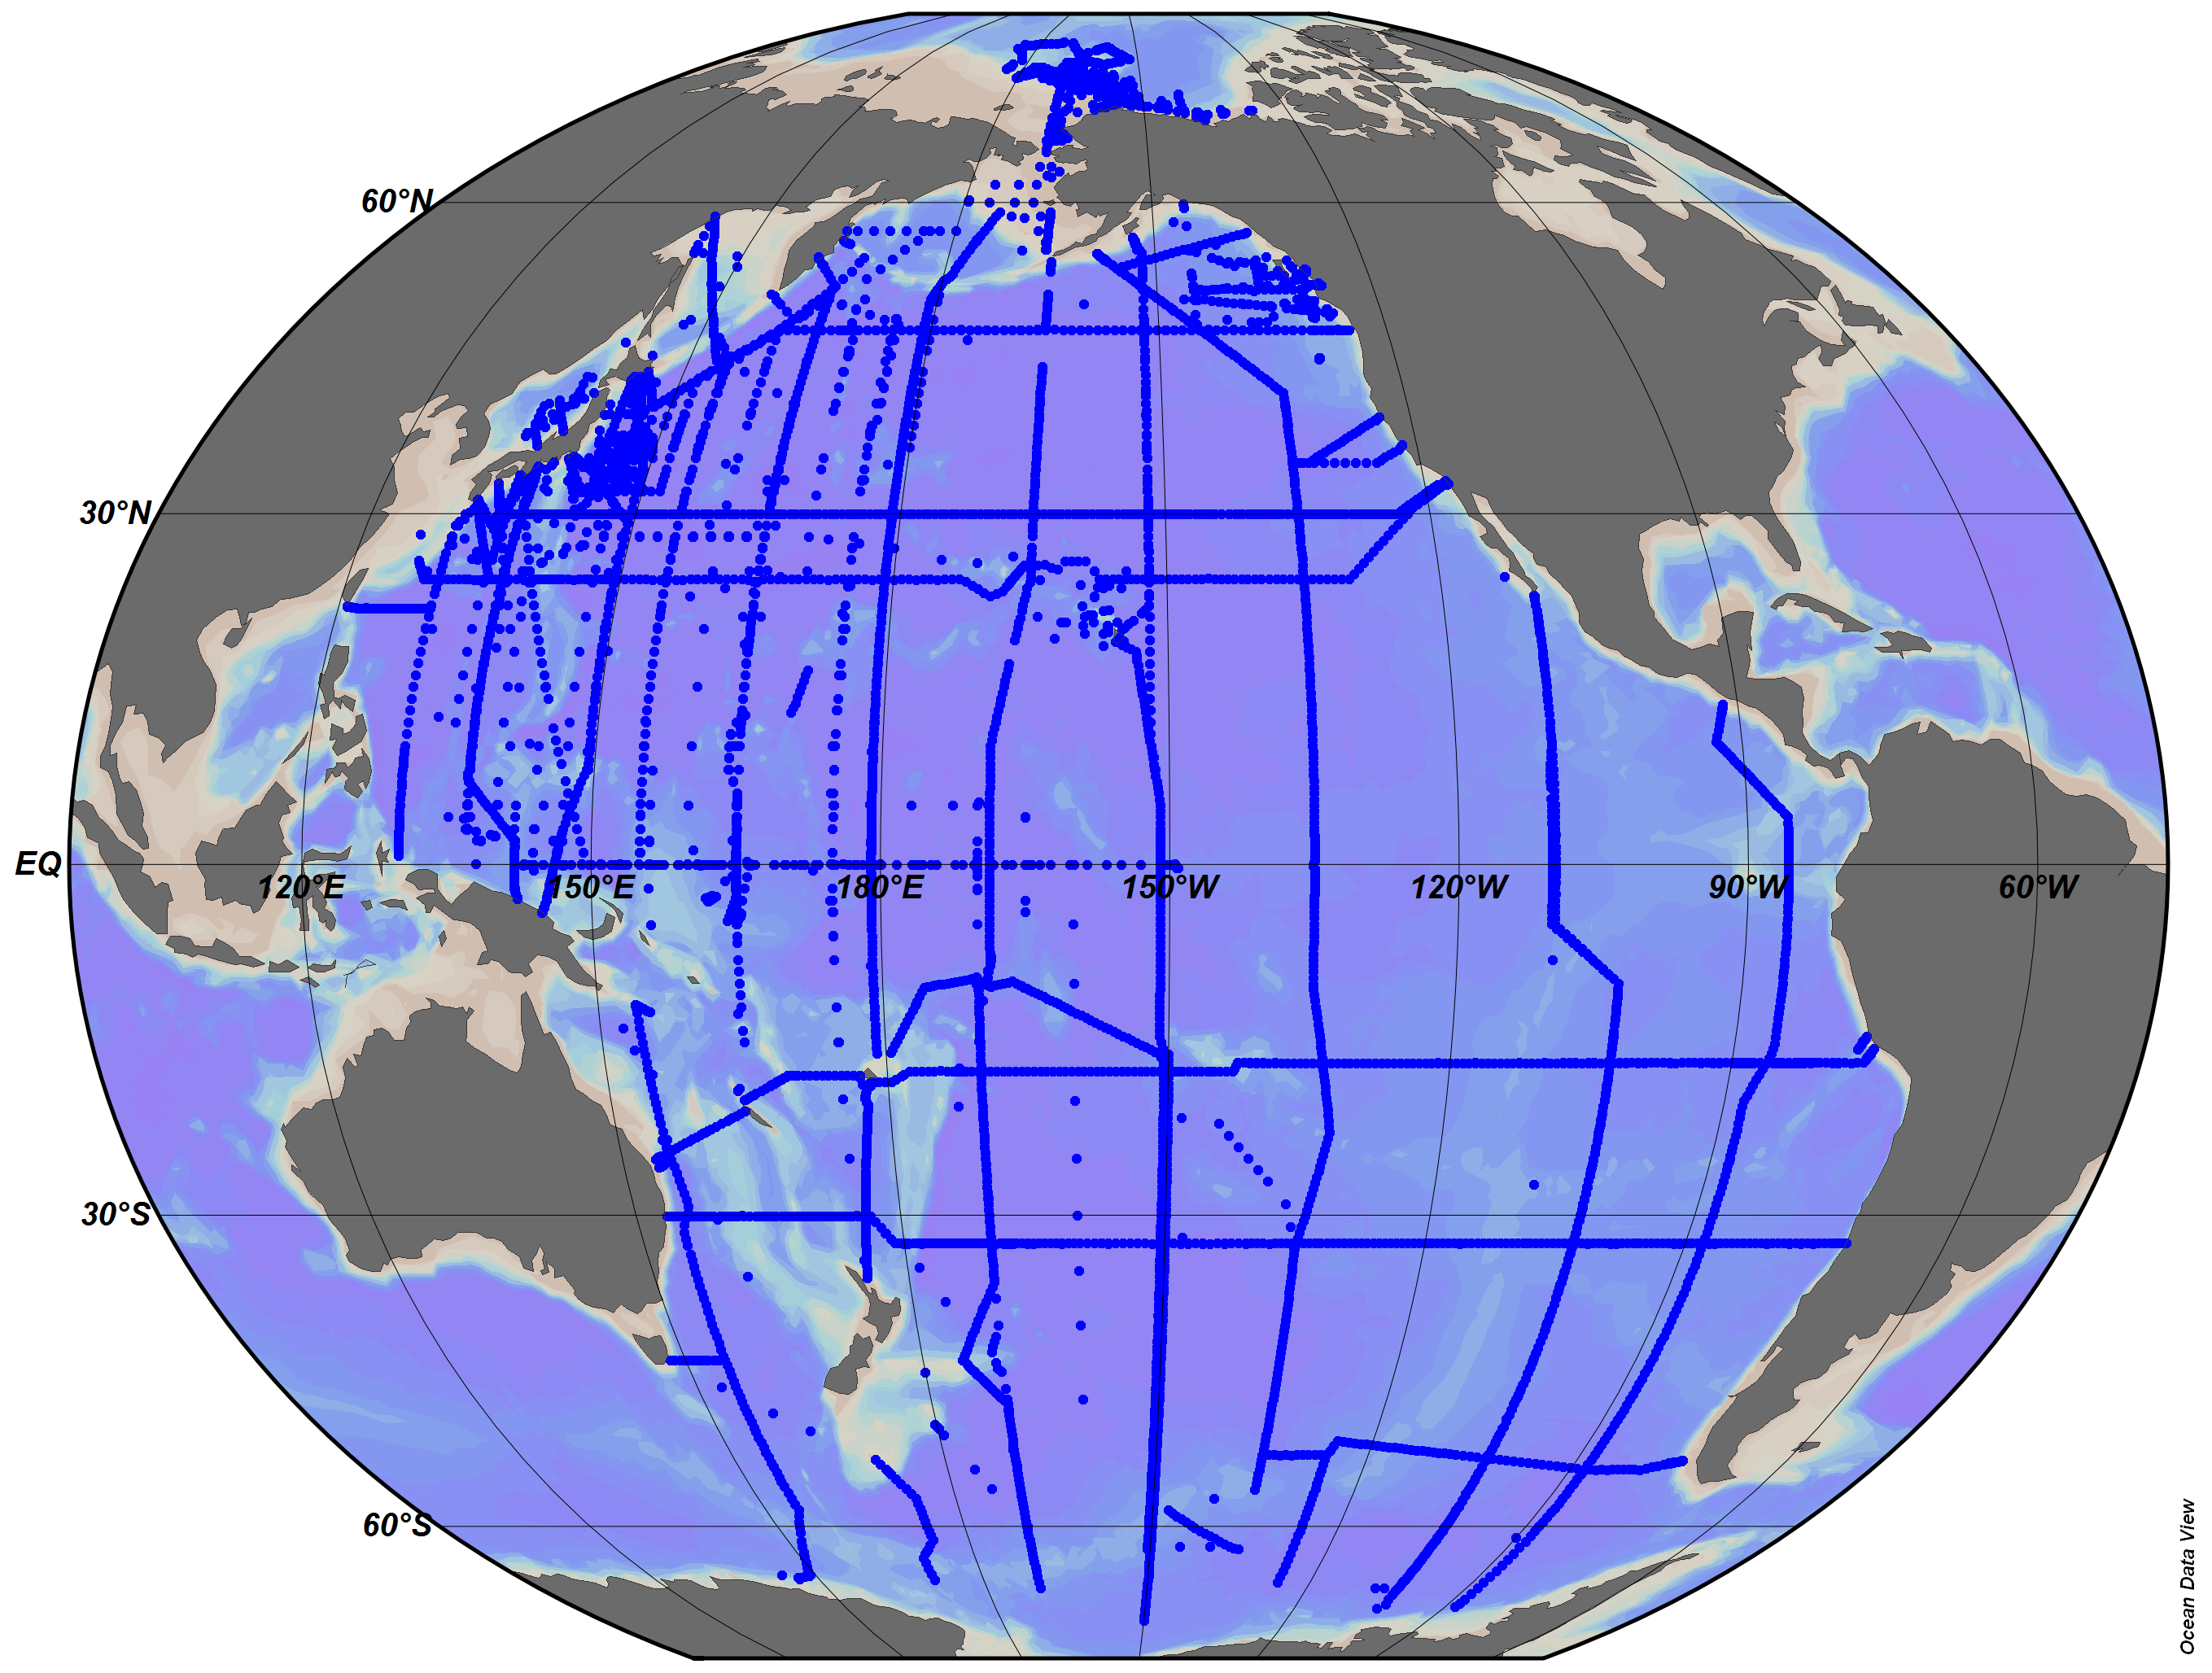
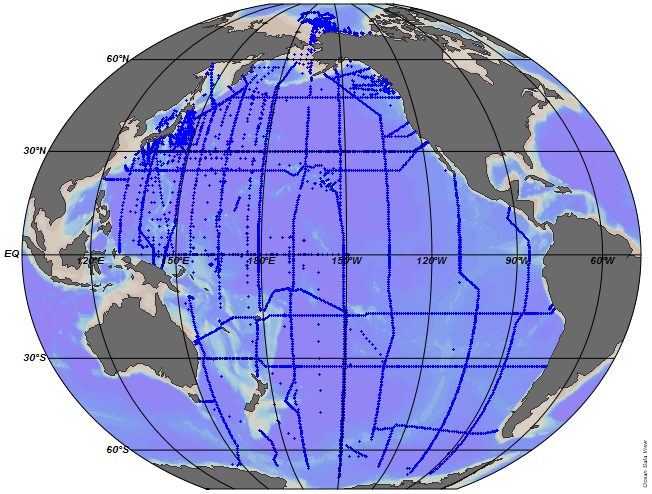
PACIFICA Source Data
PACIFICA source data (cruise files) following WHP-Exchange format are linked at PACIFICA cruise summary table.
The original WOCE and CLIVAR repeat hydrography cruises files are stored in and disseminated by OCADS (Ocean Carbon Data System; formerly CDIAC-Oceans) and CCHDO (CLIVAR and Carbon Hydrographic Data Office).
Note that some WOCE/CLIVAR files were made minor changes for PACIFICA secondary quality control.
- PACIFICAsource.zip (zip archived and compressed)
- Archived file of all PACIFICA source data files.
- PACIFICAsource_BIGARRAY.mat
- Unified MAT file of all PACIFICA source data files using excread.m script on MATLAB.
PACIFICA Adjusted Data
- PACIFICA1205.csv.zip (zip compressed)
- PACIFICA1205.csv.gz (gzip compressed)
-
- Outline
-
- WHP-Exchange format compatible (ODV can import as WHP Bottle);
- SALNTY/CTDSAL, OXYGEN, NITRAT, PHSPHT, SILCAT, TCARBN and ALKALI are applied additvie or multiplicative PACIFICA recommended adjustment values;
- Data with quality code flag 2 (Acceptable measurement) and 6 (Mean of replicate measurements) are available and other flagged data are relaced with missing value, -999 and 9, and not used for derived parameters;
- NBS or SWS unit of PH is converted to total scale;
- PH derived from TCARBN and ALKALI is inserted with flag 0 (see below), and sampling depth, AOU, potential temperature and potential density are added;
- CTDOXY, CFC11, CFC12, CFC113, CCL4, SF6, DELC14, DELC13, TRITUM, DELHE3, HELIUM and NEON are also included.
- Added/replaced parameters
-
| Label | Unit | Flag | Description |
|---|
| EXPOCODE | - | none | CCCCYYYYMMDD where CCCC is NODC Platform (ship) Code (4 characters) and YYYYMMDD is departure date of the cruise (8 digits) |
| CRUISENBR | - | none | original cruise name or EXPOCODE in original file |
| STNID | - | none | concatnation of DATE(YYYYMMDD) and TIME(hhmm).
Note that if TIME(hhmm) is blank or missing, STNNBR is added to the end but blank is replaced with '0' or non-numeric character is replaced with ASCII code. For example, DATE is '20120506' and STNNBR is 'St.1', it is '20120506000083116461'. |
| DEPTH | METER | none | Missing bottom depth (-999) is replaced by 30 arc-second gridded bathymetry data (GEBCO_08 for global or JTOPO30v2 for around Japan), or 10 memter below the maximum sampling depth at the station. |
| CTDDEPTH | METER | none | CTD depth derived from CTPRS and LATITUDE.
NOTE: For Line P cruises, value of SAMPLEDEPTH (sampling depth) are adopted. |
| PH | TS (total scale)
at 25 degree C and 1 atm. | 0 | derived from measured SALNTY, SILCAT, PHSPHT, TCARBN and ALKALI |
| AOU | UMOL/KG (μmol/kg) | none | Apparent Oxygen Utilization |
| THETA | degrees C | none | Potential Temperature |
| SIGMA0 | KG/M^3 (kg/m3) | none | Potential Density relative to 0 db |
| SIGMA1 | KG/M^3 (kg/m3) | none | Potential Density relative to 1000 db |
| SIGMA2 | KG/M^3 (kg/m3) | none | Potential Density relative to 2000 db |
| SIGMA3 | KG/M^3 (kg/m3) | none | Potential Density relative to 3000 db |
| SIGMA4 | KG/M^3 (kg/m3) | none | Potential Density relative to 4000 db |
- PACIFICA1205.mat
- Adjusted MAT file derived from PACIFICAsource_BIGARRAY.mat using this script on MATLAB.
PACIFICA Grid Statistics
- PACIFICA1205_stat.csv.zip (zip compressed)
- PACIFICA1205_stat.csv.gz (gzip compressed)
-
- Outline
-
- assignment sampling depth to standard depth;
- calculating annual, monthly and three-month mean and standard deviation in 1×1 degree square;
- longitude and latitude are shown in center of square; e.g., LON=155 and LAT=44 means 145.5 <= longitude < 155.5 and 43.5 <= latitude < 44.5;
- Format
| Column | Label | Description |
|---|
| 1 | VAR |
CTDTMP [degree C], SALNTY, CTDSAL, OXYGEN [UMOL/KG], NITRAT [UMOL/KG], SILCAT [UMOL/KG], PHSPHT [UMOL/KG], ALKALI [UMOL/KG], TCARBN [UMOL/KG], PH [total scale] |
| 2 | DEPTH | Standard Depth: 0, 10, 20, 30, 75, 100, 125, 150, 200, 250, 300, 400, 500, 600, 700, 800, 900, 1000, 1200, 1300,1400, 1500, 1750, 2000, 2500, 3000, 3500, 4000, 4500, 5000, 5500, 6000, 6500, 7000, 7500, 8000, 8500, 9000, 9500, 10000 [METER] |
| 3 | LON | Longitude [0 to 359 degree E] |
| 4 | LAT | Latitude [-90 to 90 degree N] |
| 5 | MON |
00:annual,
01:Jan, 02:Feb, 03:Mar, 04:Apr, 05:May, 06:Jun, 07:Jul, 08:Aug, 09:Sep, 10:Oct, 11:Nov, 12:Dec,
JFM:Jan-Feb-Mar, FMA:Feb-Mar-Apr, MAM:Mar-Apr-May, AMJ:Apr-May-Jun,
MJJ:May-Jun-Jul, JJA:Jun-Jul-Aug, JAS:Jul-Aug-Sep, ASO:Aug-Sep-Oct,
SON:Sep-Oct-Nov, OND:Oct-Nov-Dec, NDJ:Nov-Dec-Jan, DJF:Dec-Jan-Feb |
| 6 | N | Number of samples |
| 7 | MEAN | Mean value |
| 8 | SD | Stanard deviation if N > 1, blank if N = 1 |
|